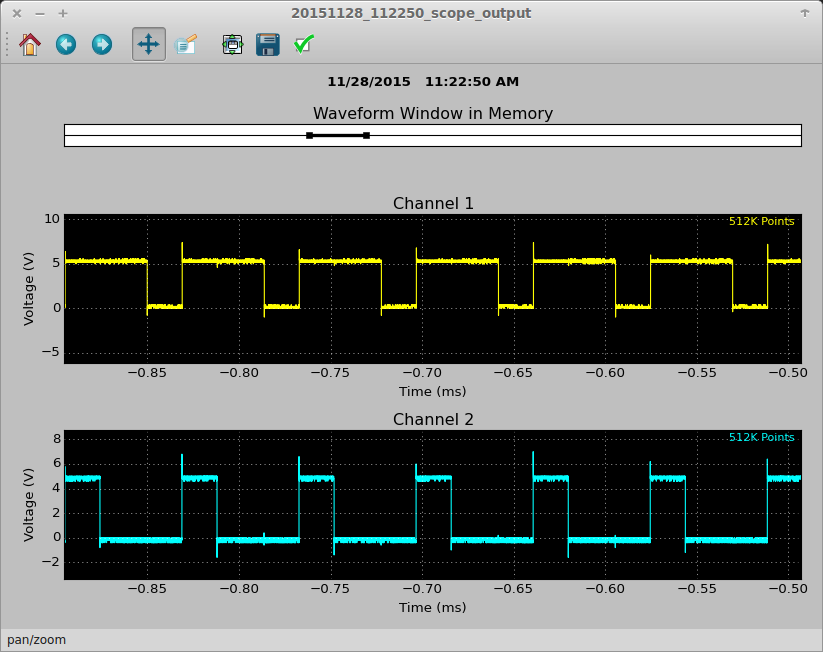
This is a simple python program (using matplotlib and numpy) for connecting to a Rigol DS1052E digital oscilloscope
and retrieving the data for display on a linux computer. Thanks to matplotlib, you can scale the data vertically
and horizontally and save images in various formats such as jpeg and png.
Requirements:
Python 2.7.x or 3.5.x
matplotlib 1.5 or later
numpy
usbtmc drivers
Installation Instructions
1. Install python, matplotlib, and numpy.
2. Install usbtmc (but many newer linux distros already have it pre-installed)
3. You may need to create a /etc/udev/rules.d/usbtmc.rules file containing the following:
# USBTMC instruments
# Rigol DS1052E
SUBSYSTEMS=="usb", ACTION=="add", ATTRS{idVendor}=="1ab1", ATTRS{idProduct}=="0588", GROUP="usbtmc", MODE="0660"
After creating the file above, add your account to the usbtmc group, and logout and back in..
4. You may need to start usbtmc the first time using "sudo modprobe usbtmc".
5. Download rigolusb.py, scope.py, and scope_gui.py to a folder.
6. Connect your DS1052E to your computer with a USB cord and run scope_gui.py and pass in the device path.
For example:
python scope_gui.py -d /dev/usbtmc1
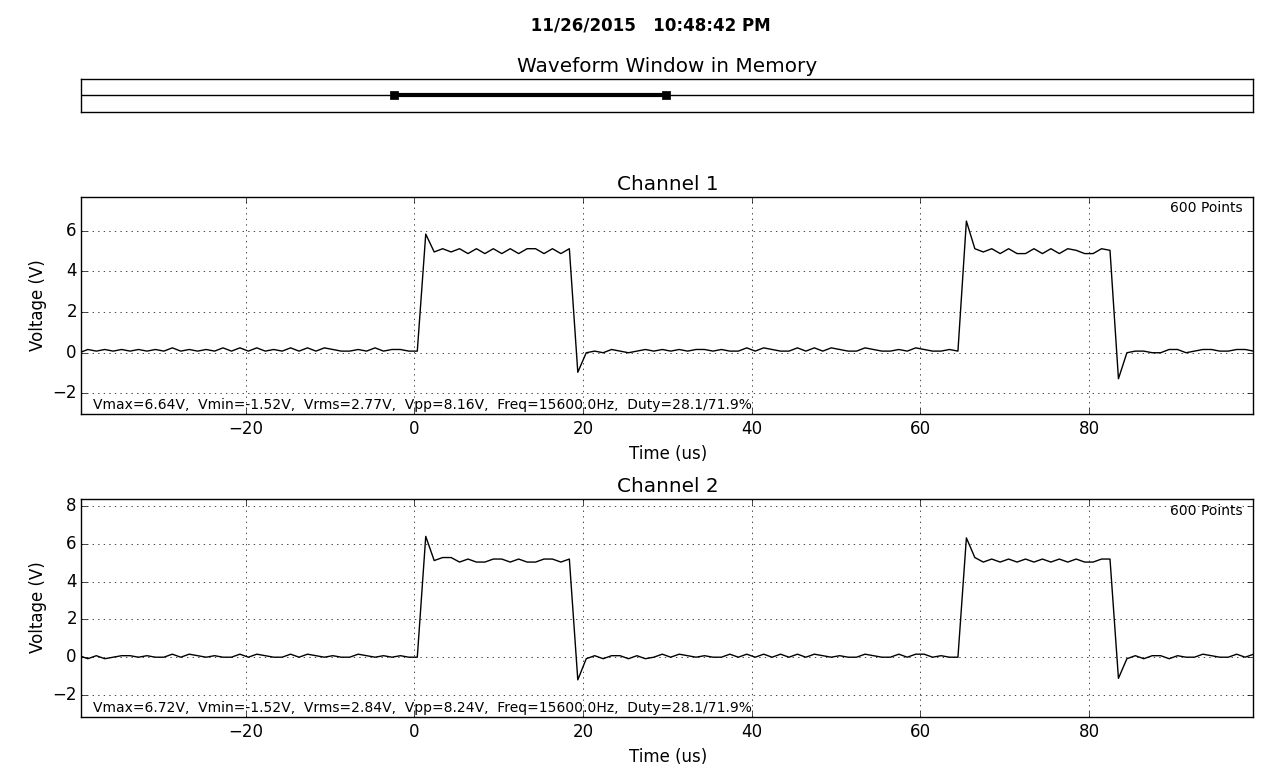
python scope_gui.py -d /dev/usbtmc1 -p Note: -p displays a printfriendly black and white graph
python scope_gui.py -d /dev/usbtmc1 -s dots Note: plots dots instead of lines
python scope_gui.py -d /dev/usbtmc1 -o mydata.dat Note: Saves scope data to a file
python scope_gui.py -d /dev/usbtmc1 -i mydata.dat Note: Opens scope data from a file
python scope_gui.py -d /dev/usbtmc1 -m NOR Note: Only retrieves 600 data points instead of entire scope memory.